


The CTO of Ripple, David Schwartz, shared in a tweet this morning that the trading volume for Ripple (XRP) as a percentage of its market cap is four times higher than that of Bitcoin’s. He questioned whether or not this was a positive metric to take note of.
Meanwhile, data from Lookonchain showed that an XRP whale moved 563,571 XRP tokens, valued at $462,000, from Binance in the past few days. Notably, this particular whale has withdrawn a total of two million XRP tokens, worth $1.66 million, from the exchange platform. As a result of this move, the whale has made an unrealized profit of approximately $640,000, with an average withdrawal price of $0.51.
While there are several possible reasons for transferring tokens from exchanges, one of the most probable explanations is for selling purposes. However, other factors cannot be ruled out entirely. For instance, the motive behind the move might be to transfer the XRP tokens into cold storage, indicating a long-term holding strategy with hopes of capitalizing on potential future price increases.
Lookonchain revealed that the XRP tokens were transferred from a hot wallet. Additionally, the analytics platform also provided insights into the buying and selling activities of four XRP whales on the Binance Smart Chain (BSC). These insights suggested a likelihood of short-term selling activity in the market.
Current Market Standing
Ripple (XRP) is ranked as the fourth biggest crypto based on its market cap, according to CoinMarketCap. It experienced a 0.62% drop in price over the last 24 hours, taking its price down to $0.78 at press time. This also put its total market cap at approximately $40.98 billion.
During this time, XRP had strengthened against both of the crypto market leaders Bitcoin (BTC) and Ethereum (ETH). At press time, XRP was up 0.07% against BTC and 0.29% against ETH. As a result, 1 XRP was worth 0.00002617 BTC and 0.0004124 ETH.
The 24-hour decrease in XRP’s price had pushed its weekly performance into the red zone as well. As a result, the remittance token was down 0.32% over the past 7 days.
Technical Overview
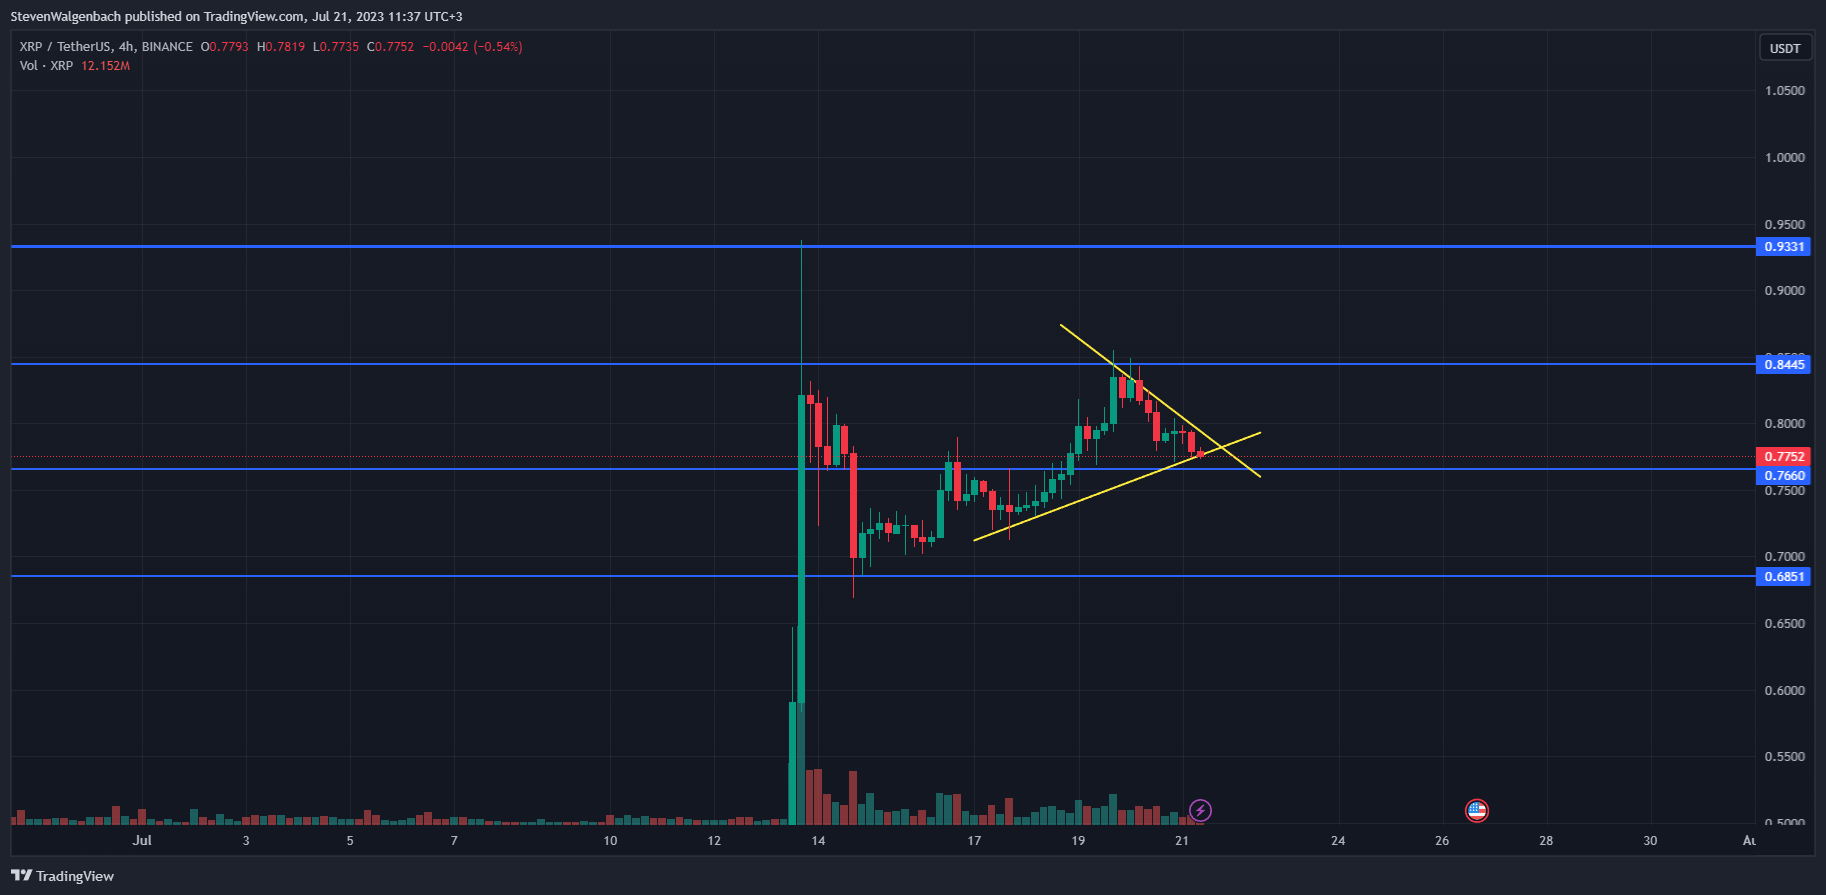
A symmetrical triangle had formed on XRP’s 4-hour chart which, if validated, may result in the remittance token’s price rising to $0.8445 in the upcoming 24 hours. The cryptocurrency may then have the momentum needed to rise to $0.9331 in the following week as well.
Conversely, the altcoin’s price may decline to the crucial support level at $0.7660 in the next 12 hours if the bullish chart pattern is not validated. Continued sell pressure may even result in XRP flipping the $0.7660 support level into resistance. In this scenario, XRP may be at risk of dropping to the next major support level at $0.6851.
There had been a fair amount of sell volume for XRP over the past 48 hours after its price was rejected by the $0.8445 resistance level on Wednesday. This resulted in the price dropping from a high of $0.8547 on Wednesday to trade at its current level – just slightly above the crucial support at $0.7660.
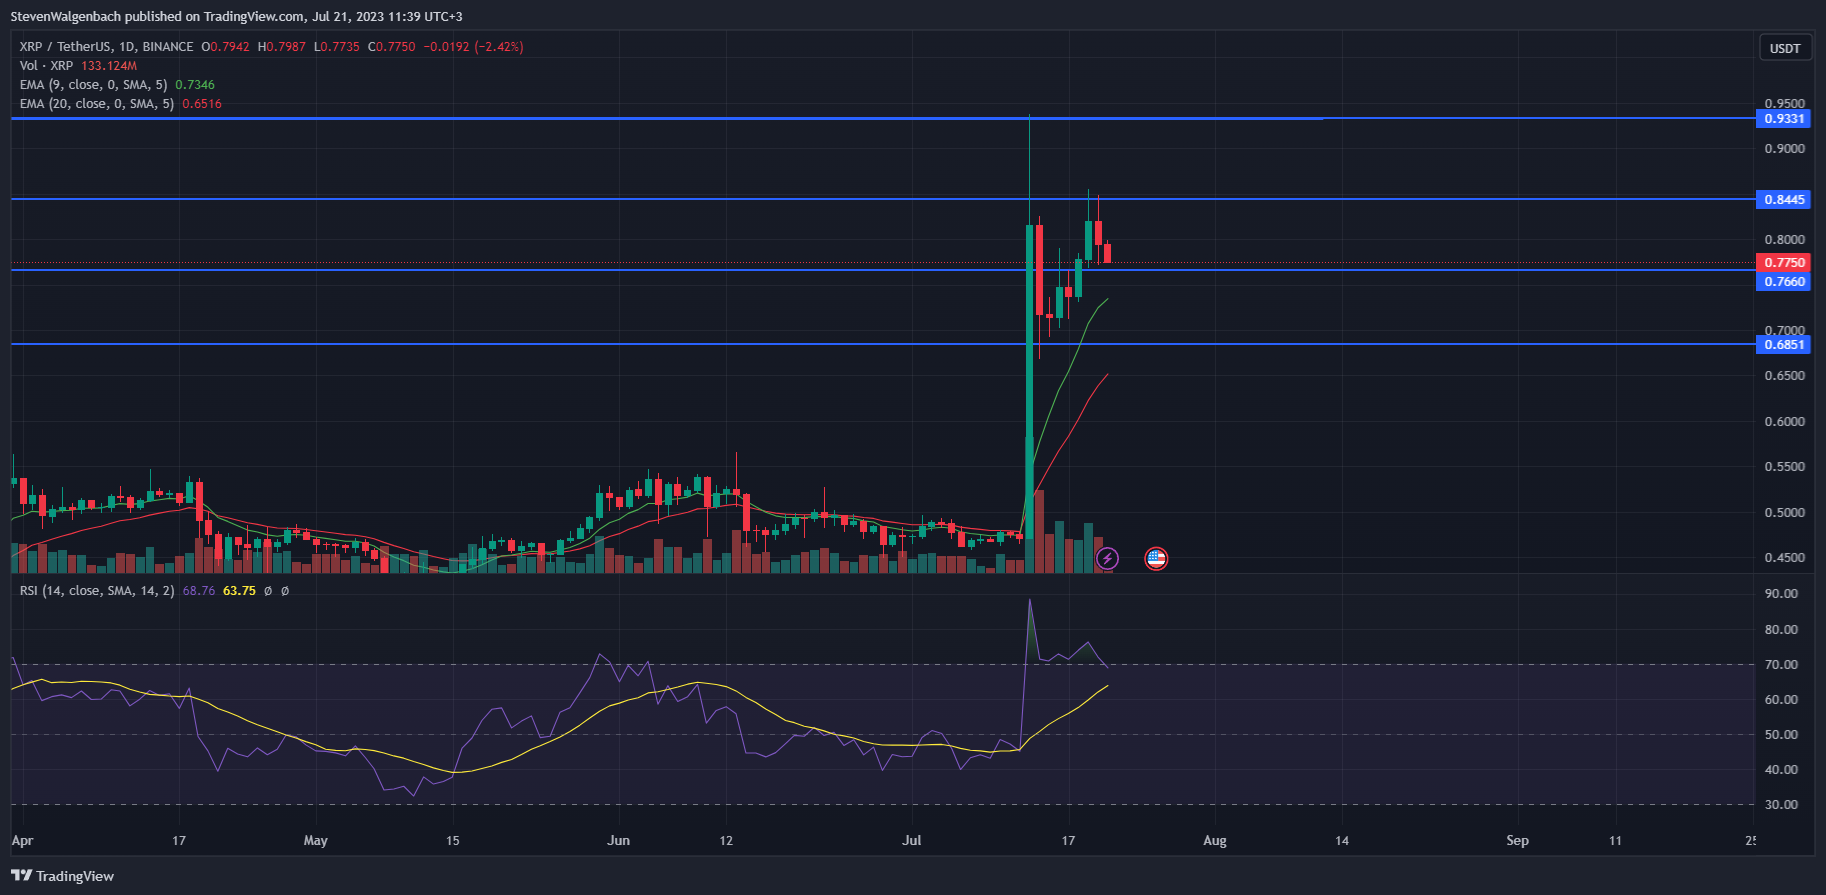
Should XRP close today’s daily candle below this major support level, then it may continue to drop to the 9-day EMA line at $0.7349 during the next 48 hours. Continued sell pressure may push the remittance token’s price below this technical indicator to $0.6851.
Short-term momentum did still favor bulls, however, as the 9-day EMA line was positioned above the longer 20-day EMA line at press time. Contradicting this bullish outlook was the daily RSI indicator, as the RSI line was on the verge of crossing below the daily RSI SMA line.
Should the daily RSI line cross below the daily RSI SMA line in the next 48 hours, it will signal a loss in XRP’s bullish momentum. This will most likely result in the altcoin’s price dropping below $0.7660 and retesting the next significant support level at $0.6851.
