


![Compound Finance’s [COMP] TVL May Not Stop a Pullback, Here’s Why](https://coinedition.com/wp-content/uploads/2023/07/DEFI-4.jpg)
In the last 30 days, Compound Finance’s (COMP) Total Value Locked (TVL) has grown by 22.09%. According to TVL aggregator DefiLlama, Compound’s TVL growth was much more than Lido Finance (LDO) and Aave (AAVE) within the same period.
TVL and Price Spike
For context, the TVL shows the total value of assets locked or staked in decentralized Applications (dApps) operating under a DeFi protocol. Therefore, the increase in Compound’s TVL means that investors perceived the protocol to be more trustworthy.
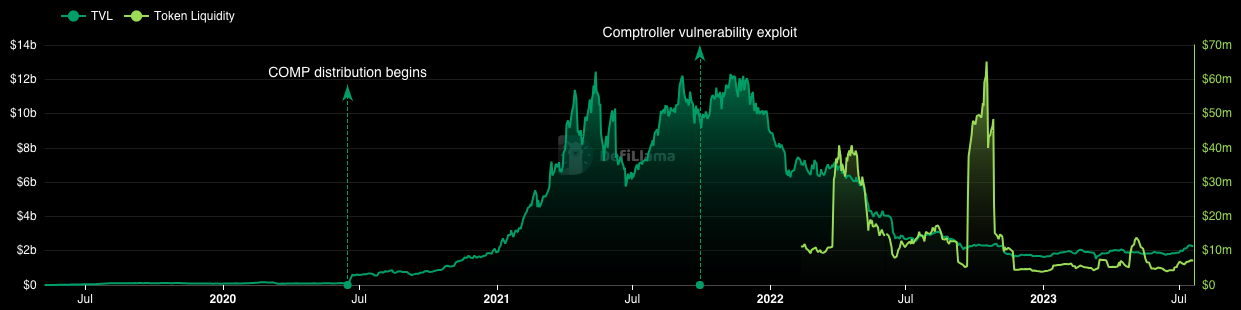
Like the TVL, the liquidity in Compound also followed the same path. The growth in liquidity suggests that there has been an increase in token swaps and the slippage require was not extremely high.
Similarly, COMP's price has incredibly grown over the last 30 days. According to CoinMarketCap, COMP increased by over 155% within the said period. But with the TVL exceeding the market cap, COMP could still be considered undervalued.
COMP Risks a Downtrend
From a technical perspective, COMP’s uptrend began with a sharp buying demand at $52.58. After rising to $76.42 on July 15, the price fell as profit-taking overrode buying pressure. In between the fall, bulls attempted to revive demand at $72.12. But the effort was quenched by selling pressure.
As of this writing, the Awesome Oscillator (AO) was -0.15. Typically, a positive AO implies that the 5-period Moving Average (MA) was more than the 34-period Moving Average (MA). But since the indicator was negative, it means that the slow MA was greater than the fast MA.
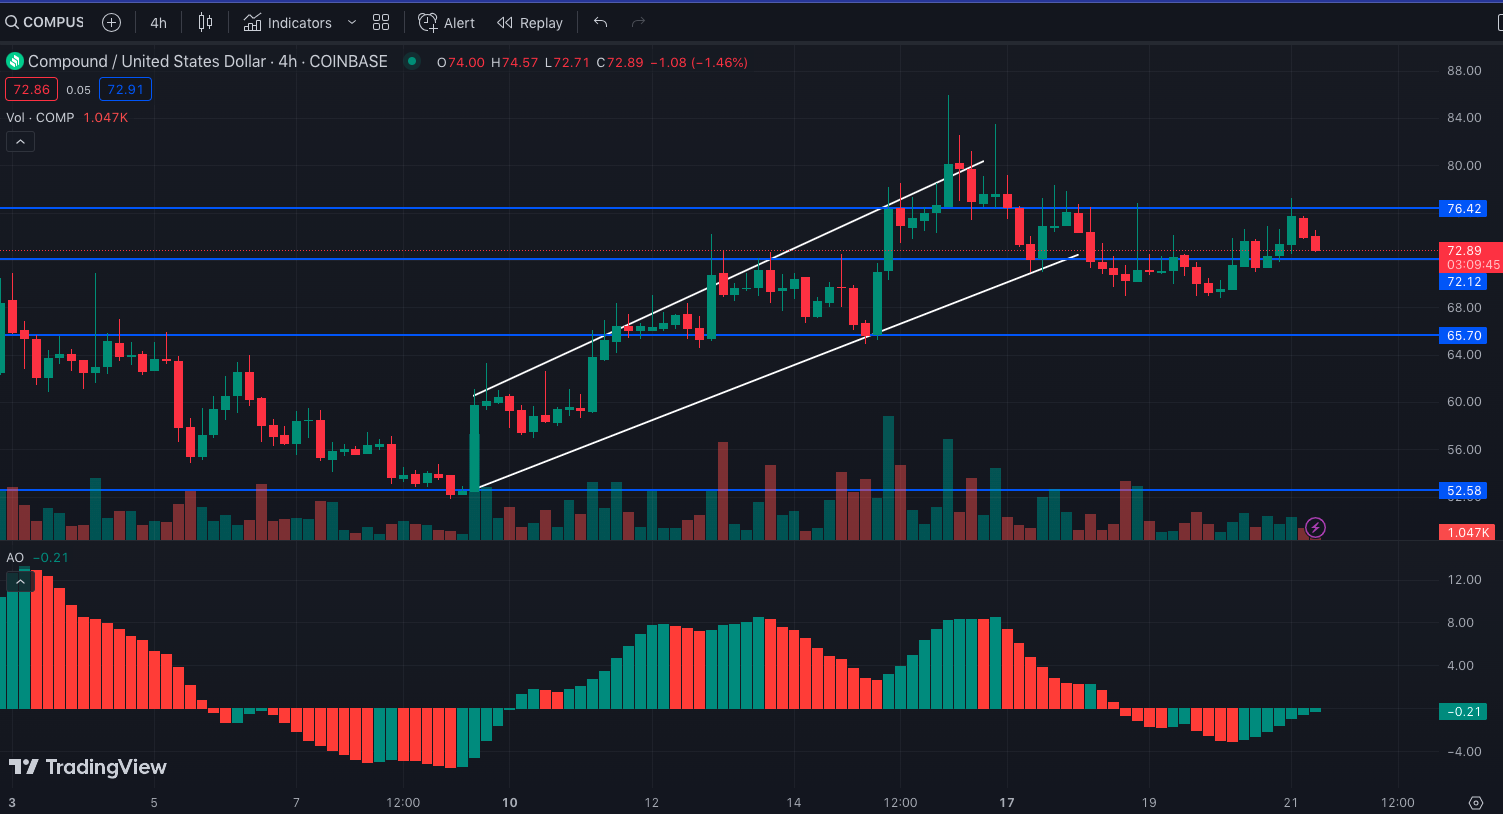
Therefore, COMP, whose 24-hour performance was a 4.32% increase, could soon succumb to a downtrend.
Additionally, the Stochastic Relative Strength Index (RSI) was 76.17. As an indicator measuring an asset’s momentum, the Stoch RSI is considered overbought when it reached 80. Conversely, when the indicator hits 20, it is oversold.
At press time, the RSI showed that COMP could be close to reaching an extreme high. If the Stoch RSI hits 80, then traders may need to watch out for a pullback.
Also, the Exponential Moving Average (EMA) indicated that COMP could be on the verge of halting its bullish streak. At the time of writing, the 20 EMA (cyan) was above the 50 EMA (yellow).
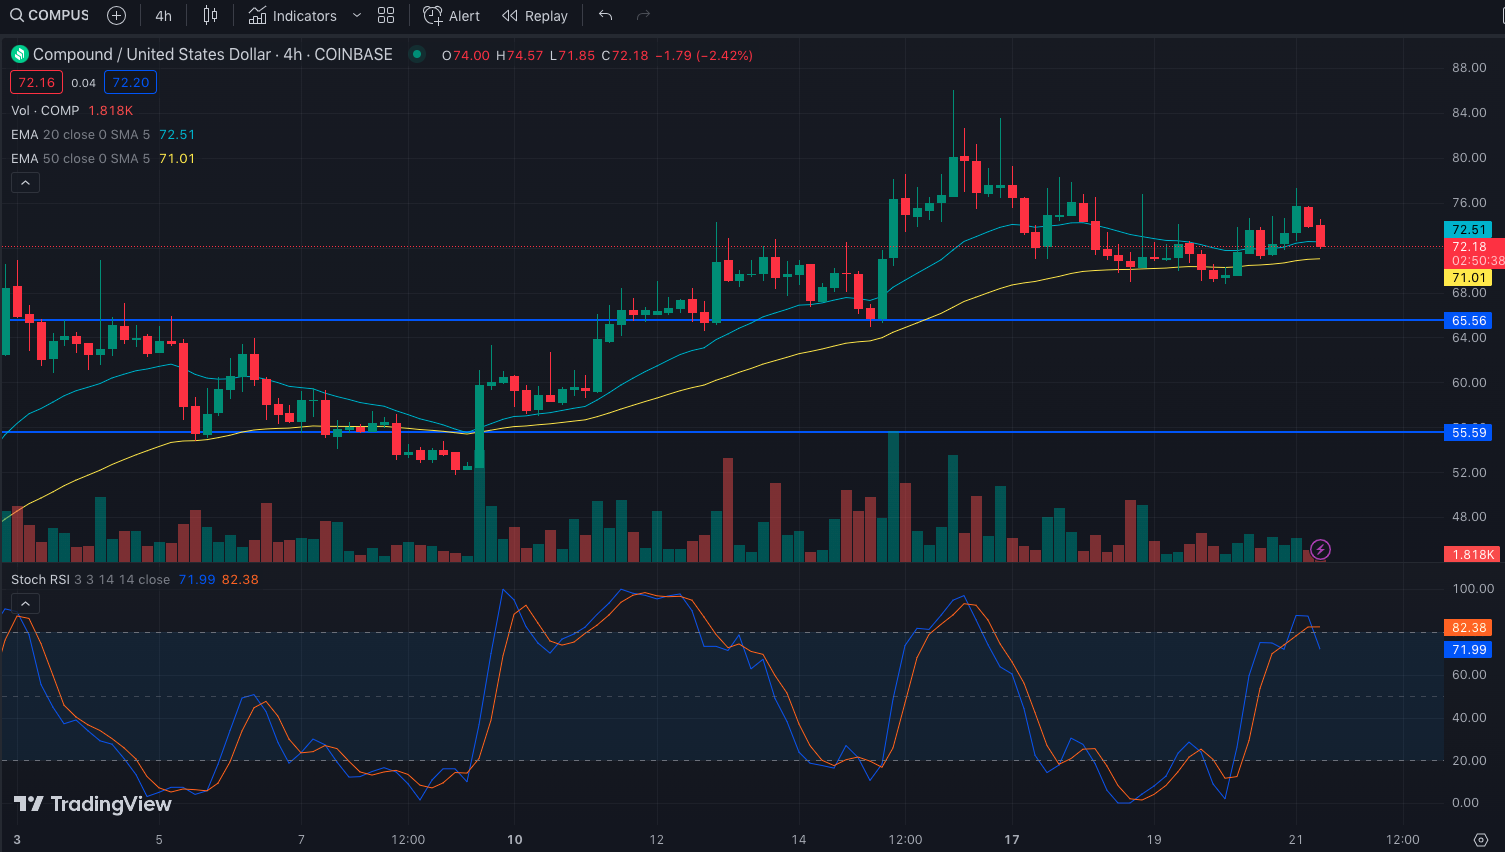
But this crossover occurred around $55.59 on July 9. Since then, the 50 EMA continued to close in on the 20 EMA. If the 50 EMA flips the 20 EMA, then COMP may have no other option than to retrace and target $65.56.
